How Can We Help?
Section V: Case Study Example
Case 1: High Biopsychosocial Risk
- age 59 veteran male employed in construction
- fall with left anterior, inferior and medial frontal lobe contusions
- preinjury drug misuse, ETOH abuse, legal-criminal involvement
- Chronic back pain
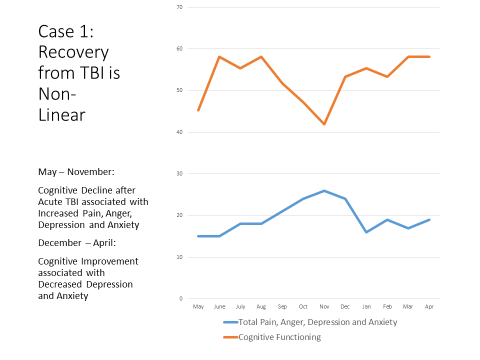
Question: is the above power point slide (from IN System for TBI) for case 1 or 2? Sequentially was before the information below.
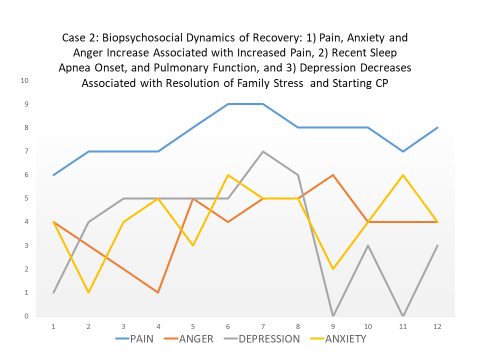
Case 2: Significant Variability in Recovery
- 18 year old female in found down along the side of road with TBI and Glasgow Coma Scale = 6/7
- Bilateral frontal subarachnoid hemorrhages, left parietal scalp hematoma, respiratory insufficiency
- Left hemiplegia, significant attention and executive function impairment
- Pre-injury anxiety and learning disability
Case 3: Sometimes it is easier to tell an avatar
- 36 year old married male working as a carpenter
- Motor cycle crash with TBI and bilateral temporal and orbital fractures 1 month before entering RF
- Pre-injury history of opioid misuse and depression
- In Resource Facilitation intake, twice denied depression
- On PHQ-9, endorsed “Thoughts that you would be better off dead, or hurting yourself.”
- Triggered Resource Facilitation response and got participant into treatment
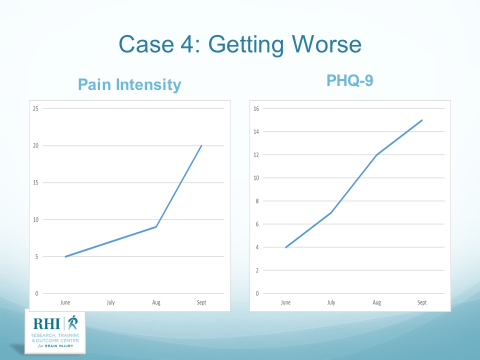
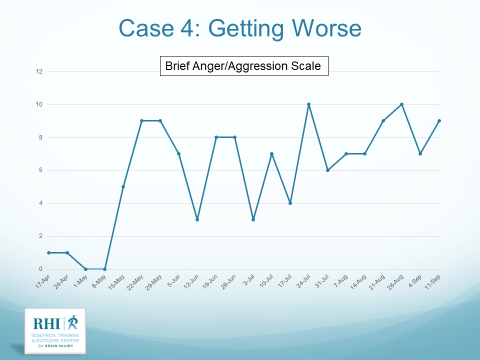
Case 4: Getting worse
- 30 year old man with 16 years of education working as a server
- Preinjury history of DUI and felony theft
- Fell out of a second story window and may have been using ETOH and Xanax at party beforehand
- Initial risk stratification was low risk
- Risk Stratification changed to medium (yellow) with more intense RF follow-up, case conferences and directed to PCP
Should we add Judy’s/Lance color coded matrix of rectangles (with a brief explanation)? I think it summarizes this topic well.